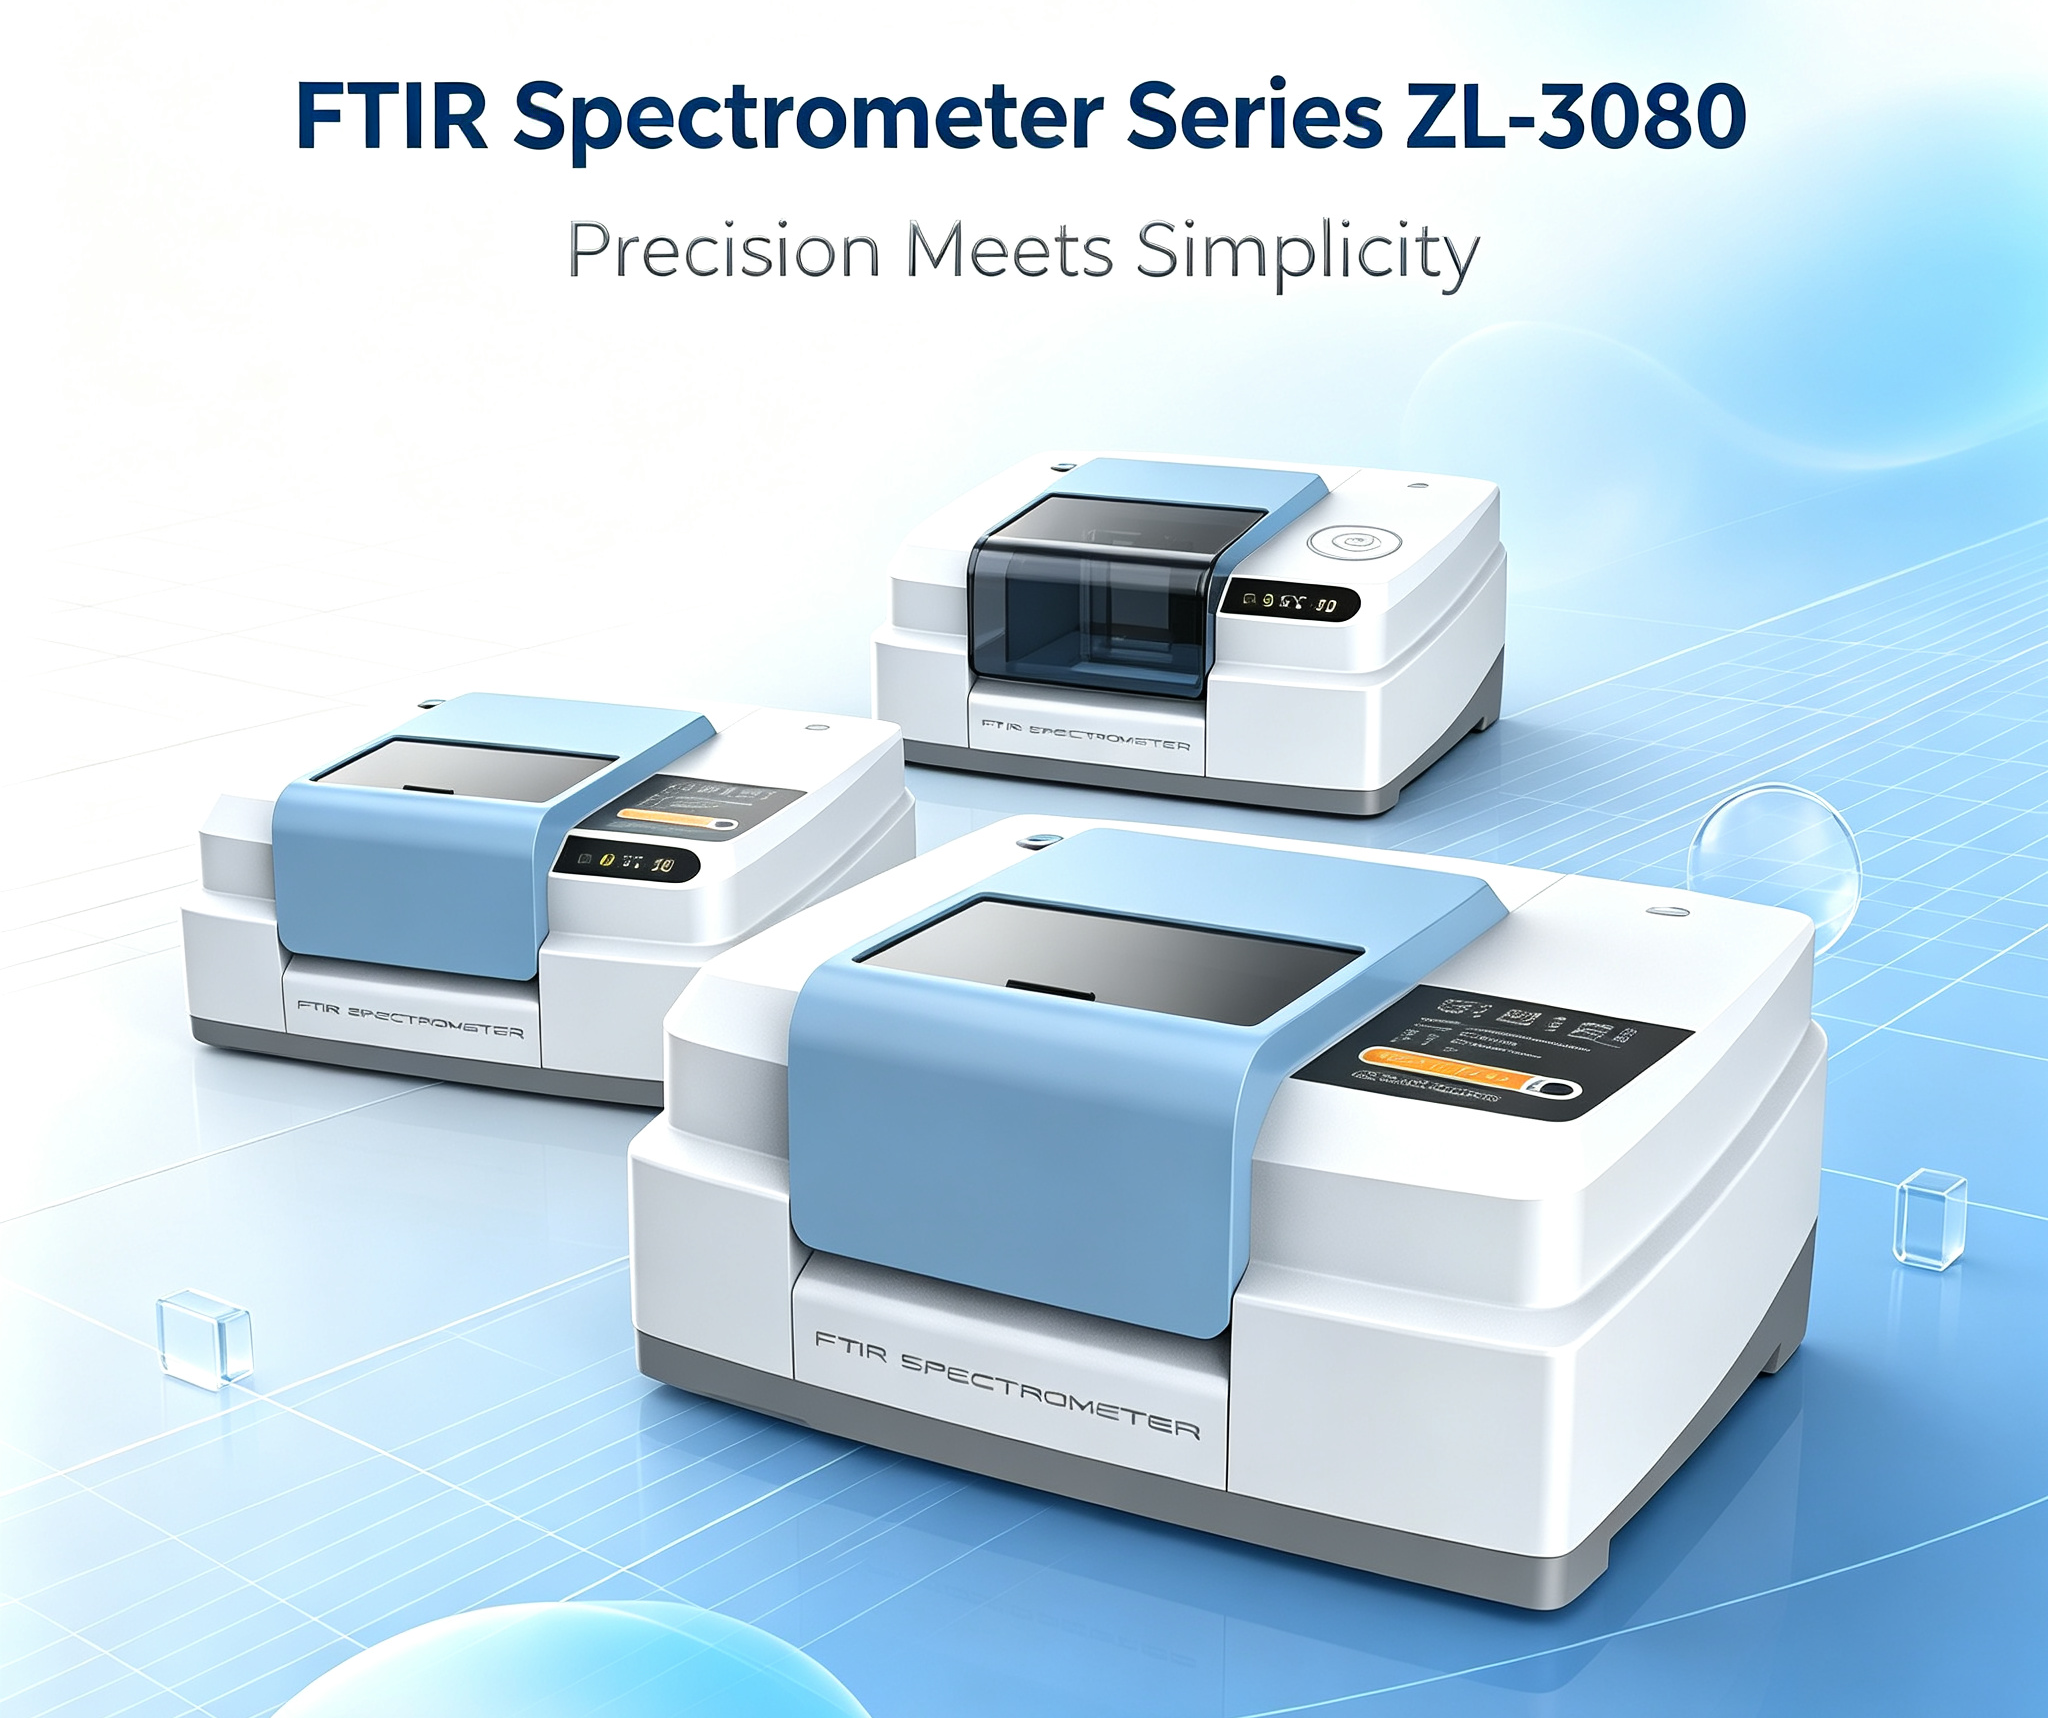
In simple terms, FTIR is a technique that takes a “molecular fingerprint” of a substance. When infrared light hits a sample, different chemical bonds absorb specific wavelengths of light, creating a unique absorption pattern—just like every person has a unique fingerprint, every molecule has its own “spectral fingerprint”.
The name comes from the Fourier Transform in mathematics—a method that separates a “mixed signal” into individual components.
Think of it like this: You’re at a symphony concert, all instruments playing together. Your ears hear the combined sound. But if you had a tool that could separate each instrument’s sound, you could analyze what the violin, cello, and flute played individually. FTIR is exactly that tool!
A traditional IR spectrometer works like “scanning one instrument at a time”—looking at one wavelength, then slowly moving to the next. ZL-3080 FTIR works like “taking a family photo”—capturing all wavelengths at once, then using math to separate them.
How It Works
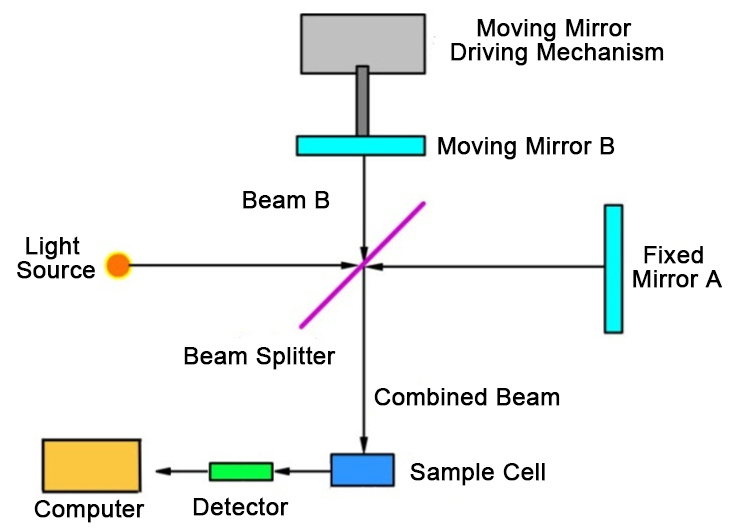
The heart of FTIR is an optical device called the Michelson Interferometer.
Step 1: Interferogram
Light from the source enters the interferometer and is split into two beams by the beamsplitter: one goes to a fixed mirror, the other to a moving mirror. When they reflect back and recombine, because the moving mirror changes position, the two beams have different path lengths, creating interference—sometimes they reinforce each other (like two water waves meeting peak-to-peak = higher), sometimes they cancel out (like peak meeting trough = flat). The detector records this “light intensity vs. mirror position” curve—that’s the interferogram.
Step 2: Sample Absorption
The interferogram beam passes through the sample, where molecules selectively absorb specific wavelengths—the interferogram’s “shape” changes
Step 3: Fourier Transform — The computer applies a Fourier Transform to the interferogram, converting the “position-domain” signal into a “frequency-domain” signal, giving us the final infrared spectrum:
X-axis = wavenumber (cm⁻¹) — think of this as the “ID number” of light’s color: larger numbers mean shorter-wavelength/higher-energy light (more “blue”), smaller numbers mean longer-wavelength/lower-energy light (more “red”).
Y-axis = absorbance or transmittance — the higher the peak, the more of that specific chemical bond is present.
Application Case Additions:
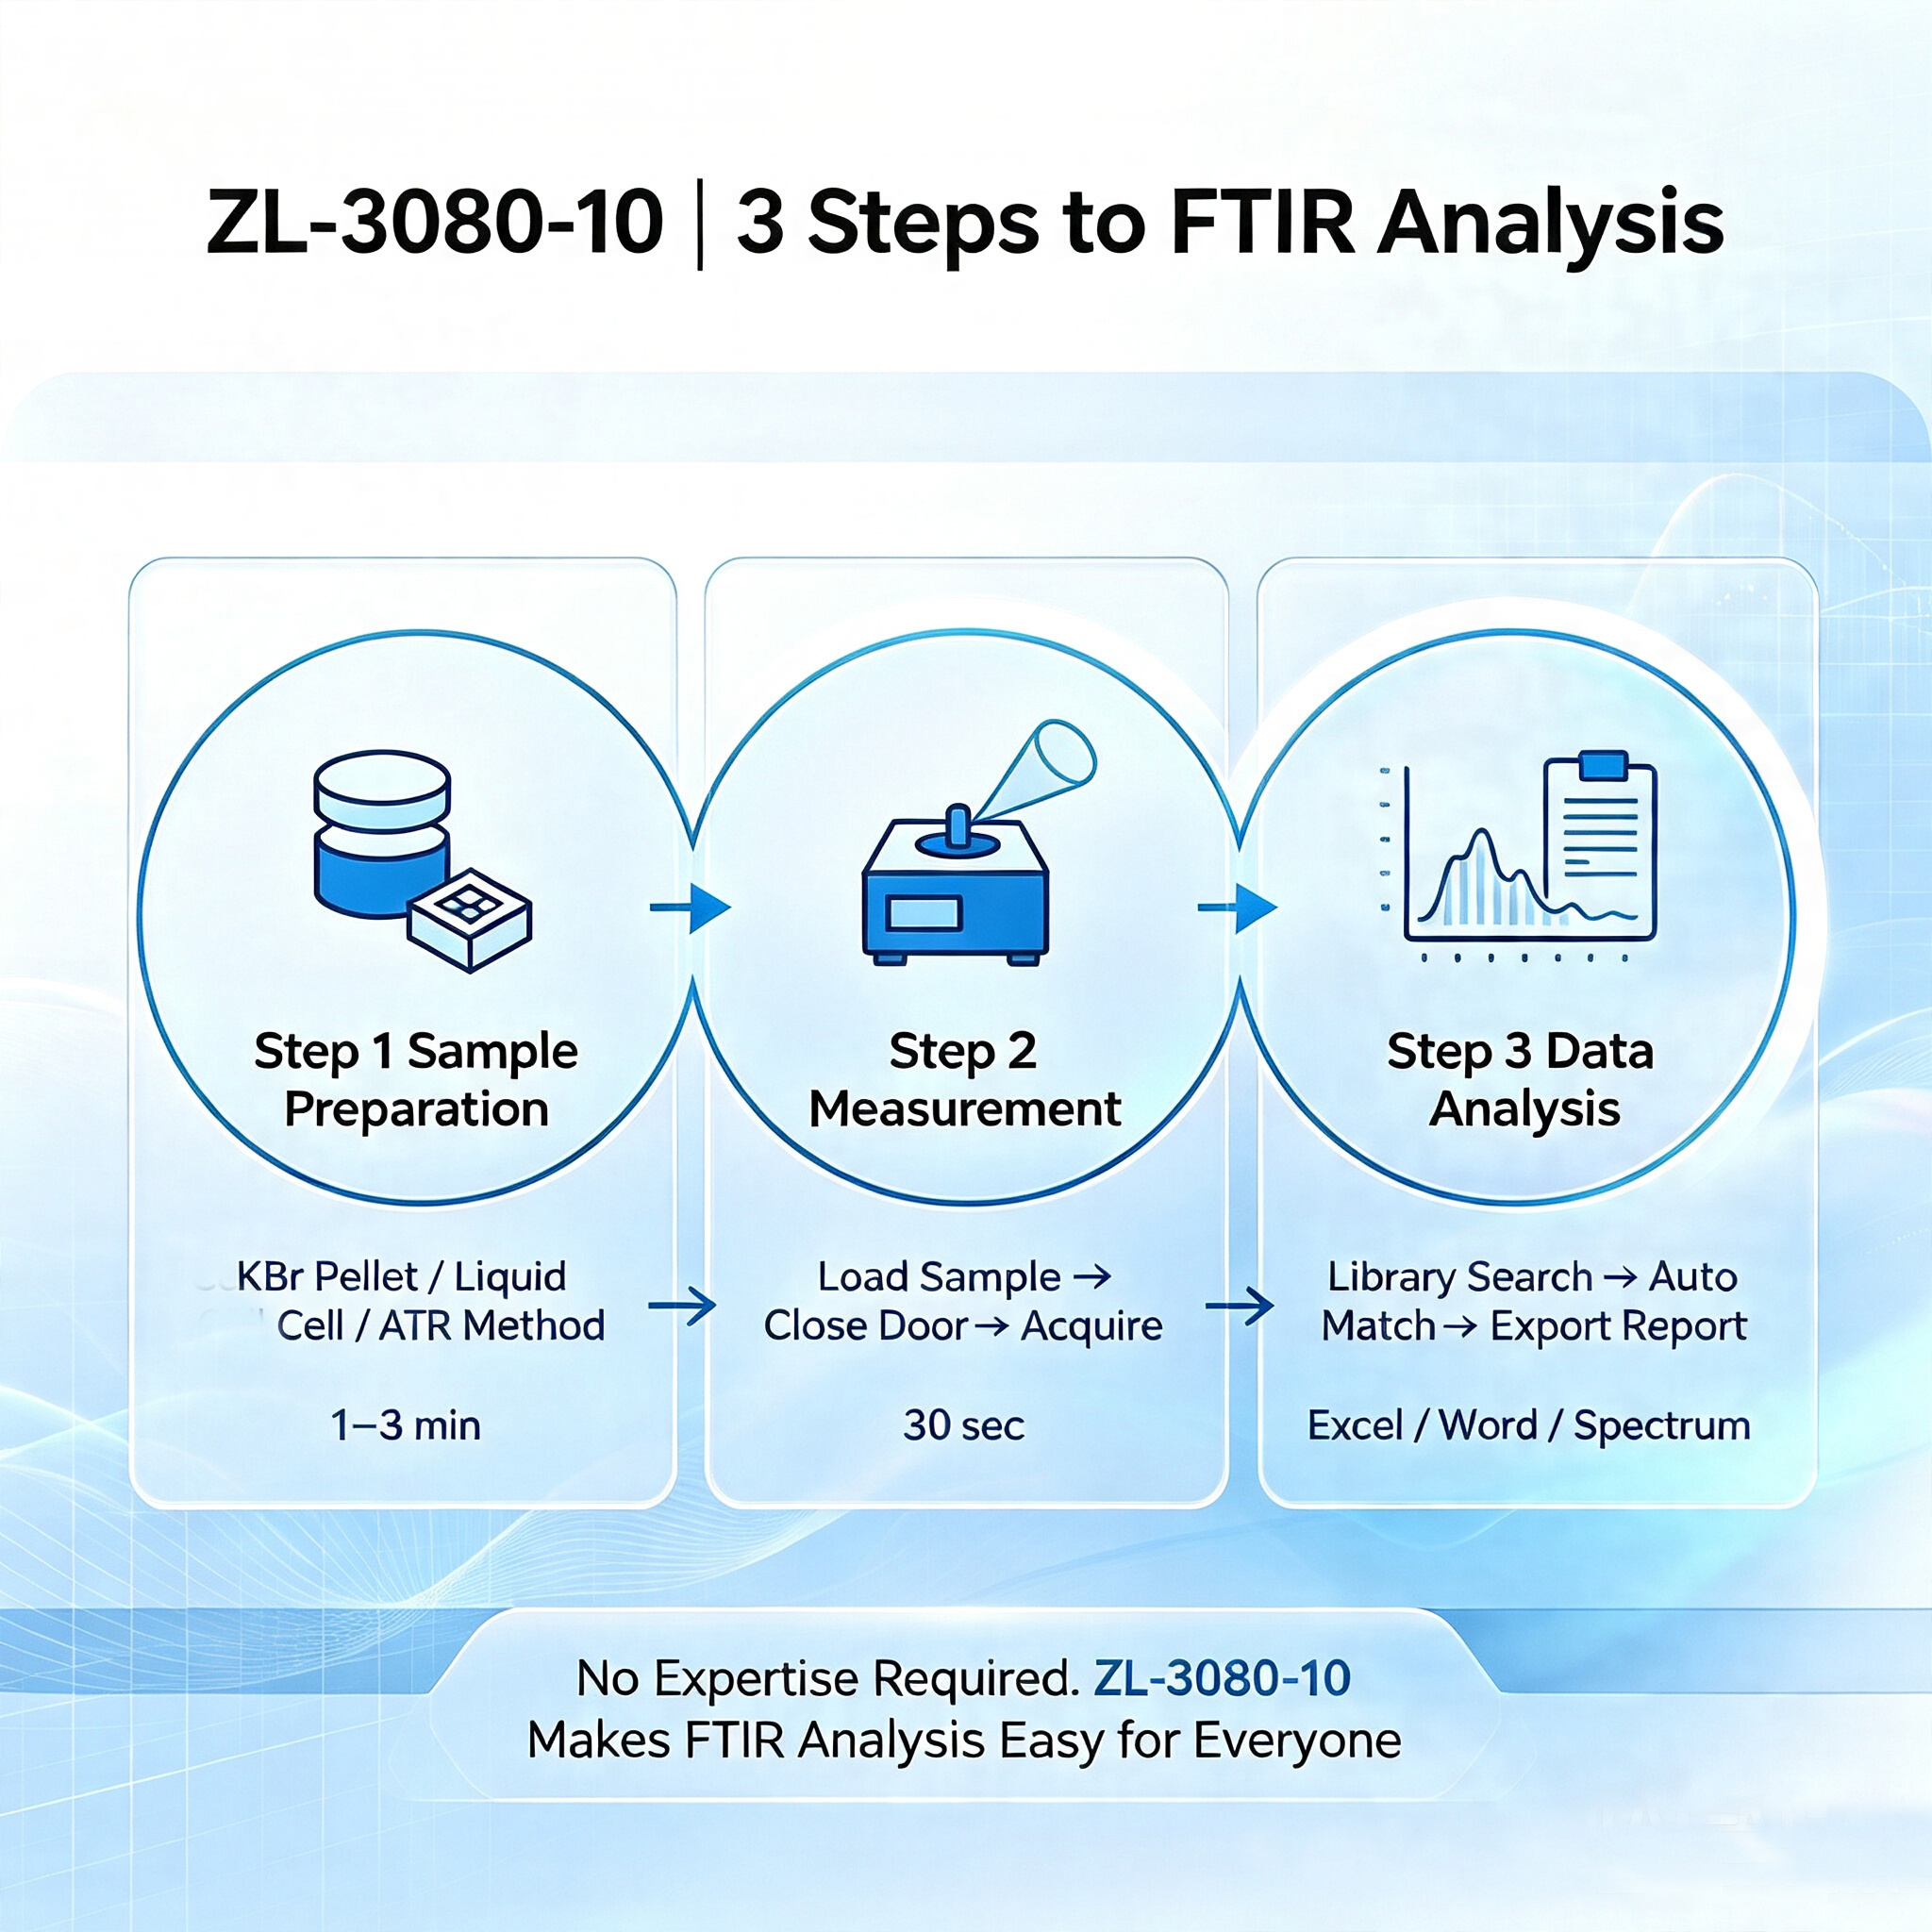
In the electronics industry, FTIR is frequently used for rapid identification of micro-contaminants on PCB surfaces. For instance, conductive failure spots on gold fingers can be quickly identified as flux residue, silicone oil contamination, or adhesive overflow via micro-FTIR, helping factories trace cleaning or dispensing process issues.
Consumer Goods Case: Is That “Food-Grade” Phone Case Really Food-Grade?
Many phone cases claiming to be “food-grade” TPU (Thermoplastic Polyurethane) or silicone may actually be doped with cheap recycled PP (Polypropylene) or PE (Polyethylene) scrap. FTIR can quickly “catch” these adulterants right at the incoming goods stage—by comparing characteristic absorption peaks, it can tell within minutes whether the material is pure or contaminated. This makes FTIR the first security checkpoint at the material receiving dock, long before any time-consuming migration safety tests are conducted.
Three Key Advantages
1.Speed
Traditional spectrometers look at one wavelength at a time—scanning the whole spectrum takes minutes. FTIR looks at all wavelengths at once—a scan takes just seconds. This is critical for fast-testing scenarios like production line QC or environmental emergency monitoring.
This is called the Multiplex Advantage, also known as the Fellgett Advantage.
2.High Optical Throughput
FTIR has no slits like traditional spectrometers, so more light reaches the sample and detector. This means higher sensitivity and better signal-to-noise ratio.
This is called the Throughput Advantage, also known as the Jacquinot Advantage.
3.High Wavenumber Accuracy
FTIR uses a laser as an internal wavelength reference, so the measured wavenumbers are very accurate and stable over time. This is crucial for building standard spectral libraries and quantitative analysis.
Main Applications
| Industry | Application |
| Polymers | Material identification, additive analysis, degradation studies |
| Pharmaceuticals | API identification, polymorph analysis, QC |
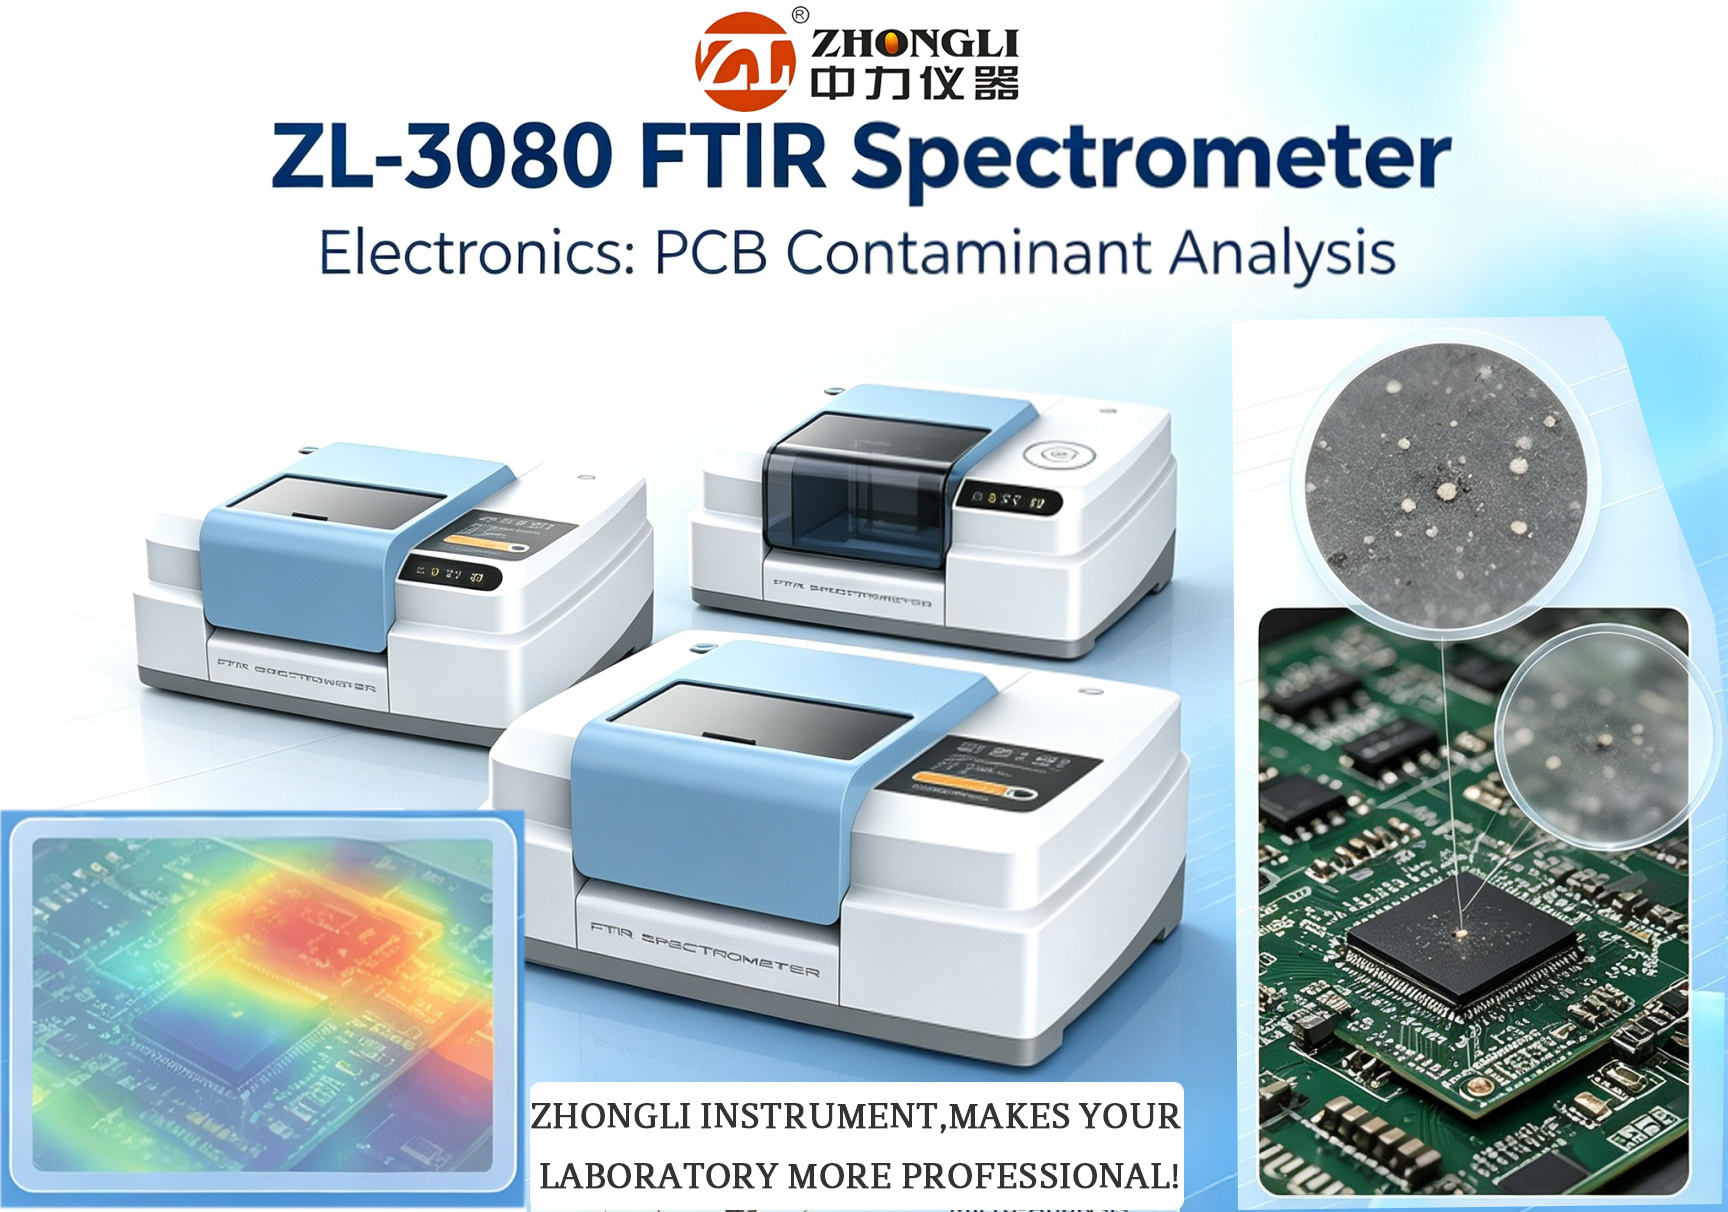
| Environmental | Gas emission monitoring (VOCs, CO₂, NOx, etc.), water analysis |
| Food Safety | Adulteration detection, composition analysis |
| Electronics Contaminant Analysis | Identifying micro-contaminants on PCBs |
| Materials Science | Nanomaterials and composite characterization |
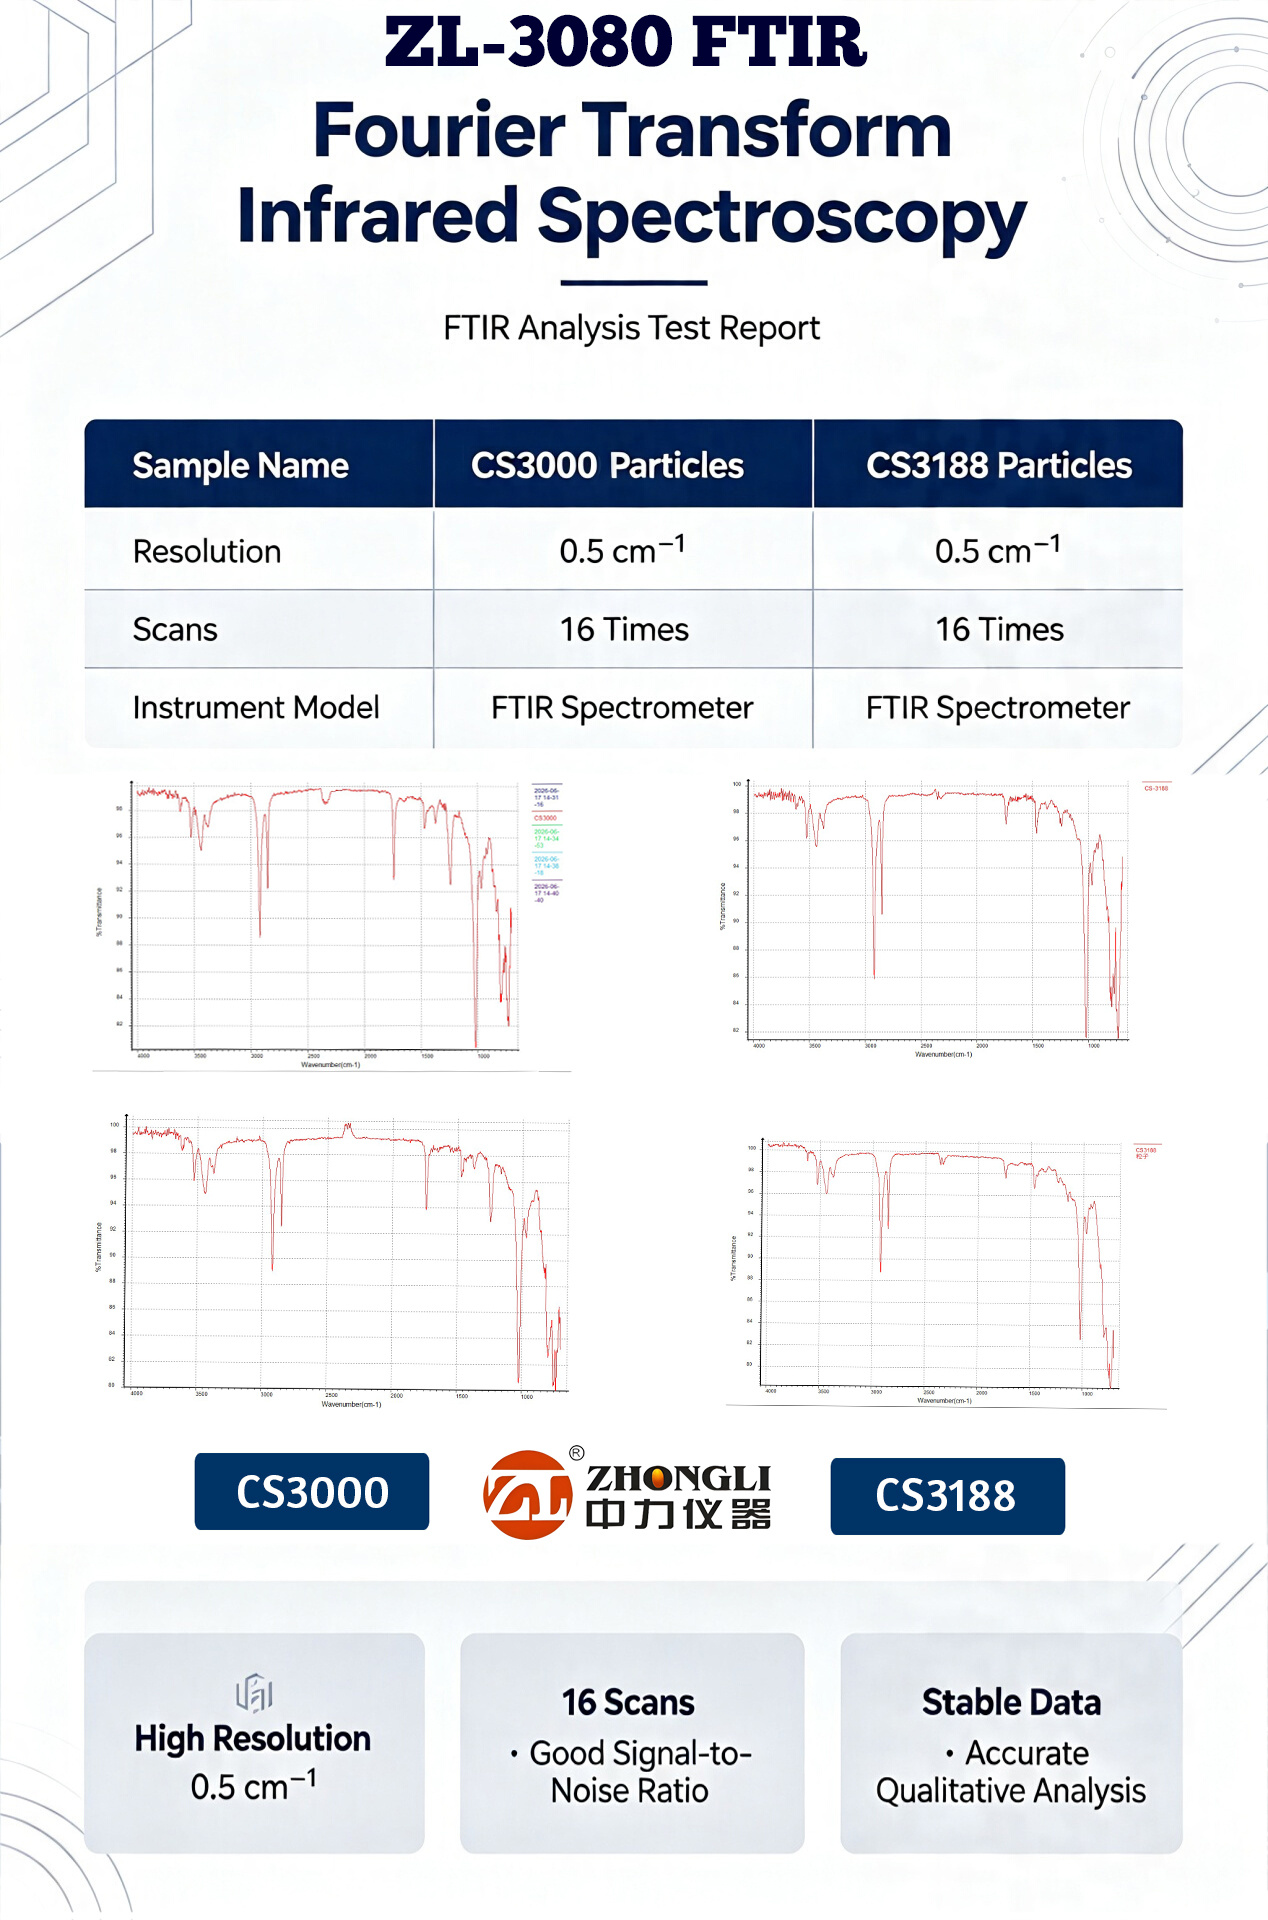
How to Read ZL-3080 FTIR Spectrum?
An FTIR spectrum has three key elements:
1.Peak Position: Where the absorption peak sits on the x-axis (wavenumber). Different functional groups have fixed characteristic peak positions—e.g., C=O is usually around 1700 cm⁻¹, O-H around 3300 cm⁻¹.
2.Peak Intensity: The peak’s height or area. More of a functional group = stronger peak.
3.Peak Shape: The peak’s width and symmetry. The same functional group can show different shapes in different chemical environments—e.g., O-H peaks become wider when hydrogen bonding occurs.
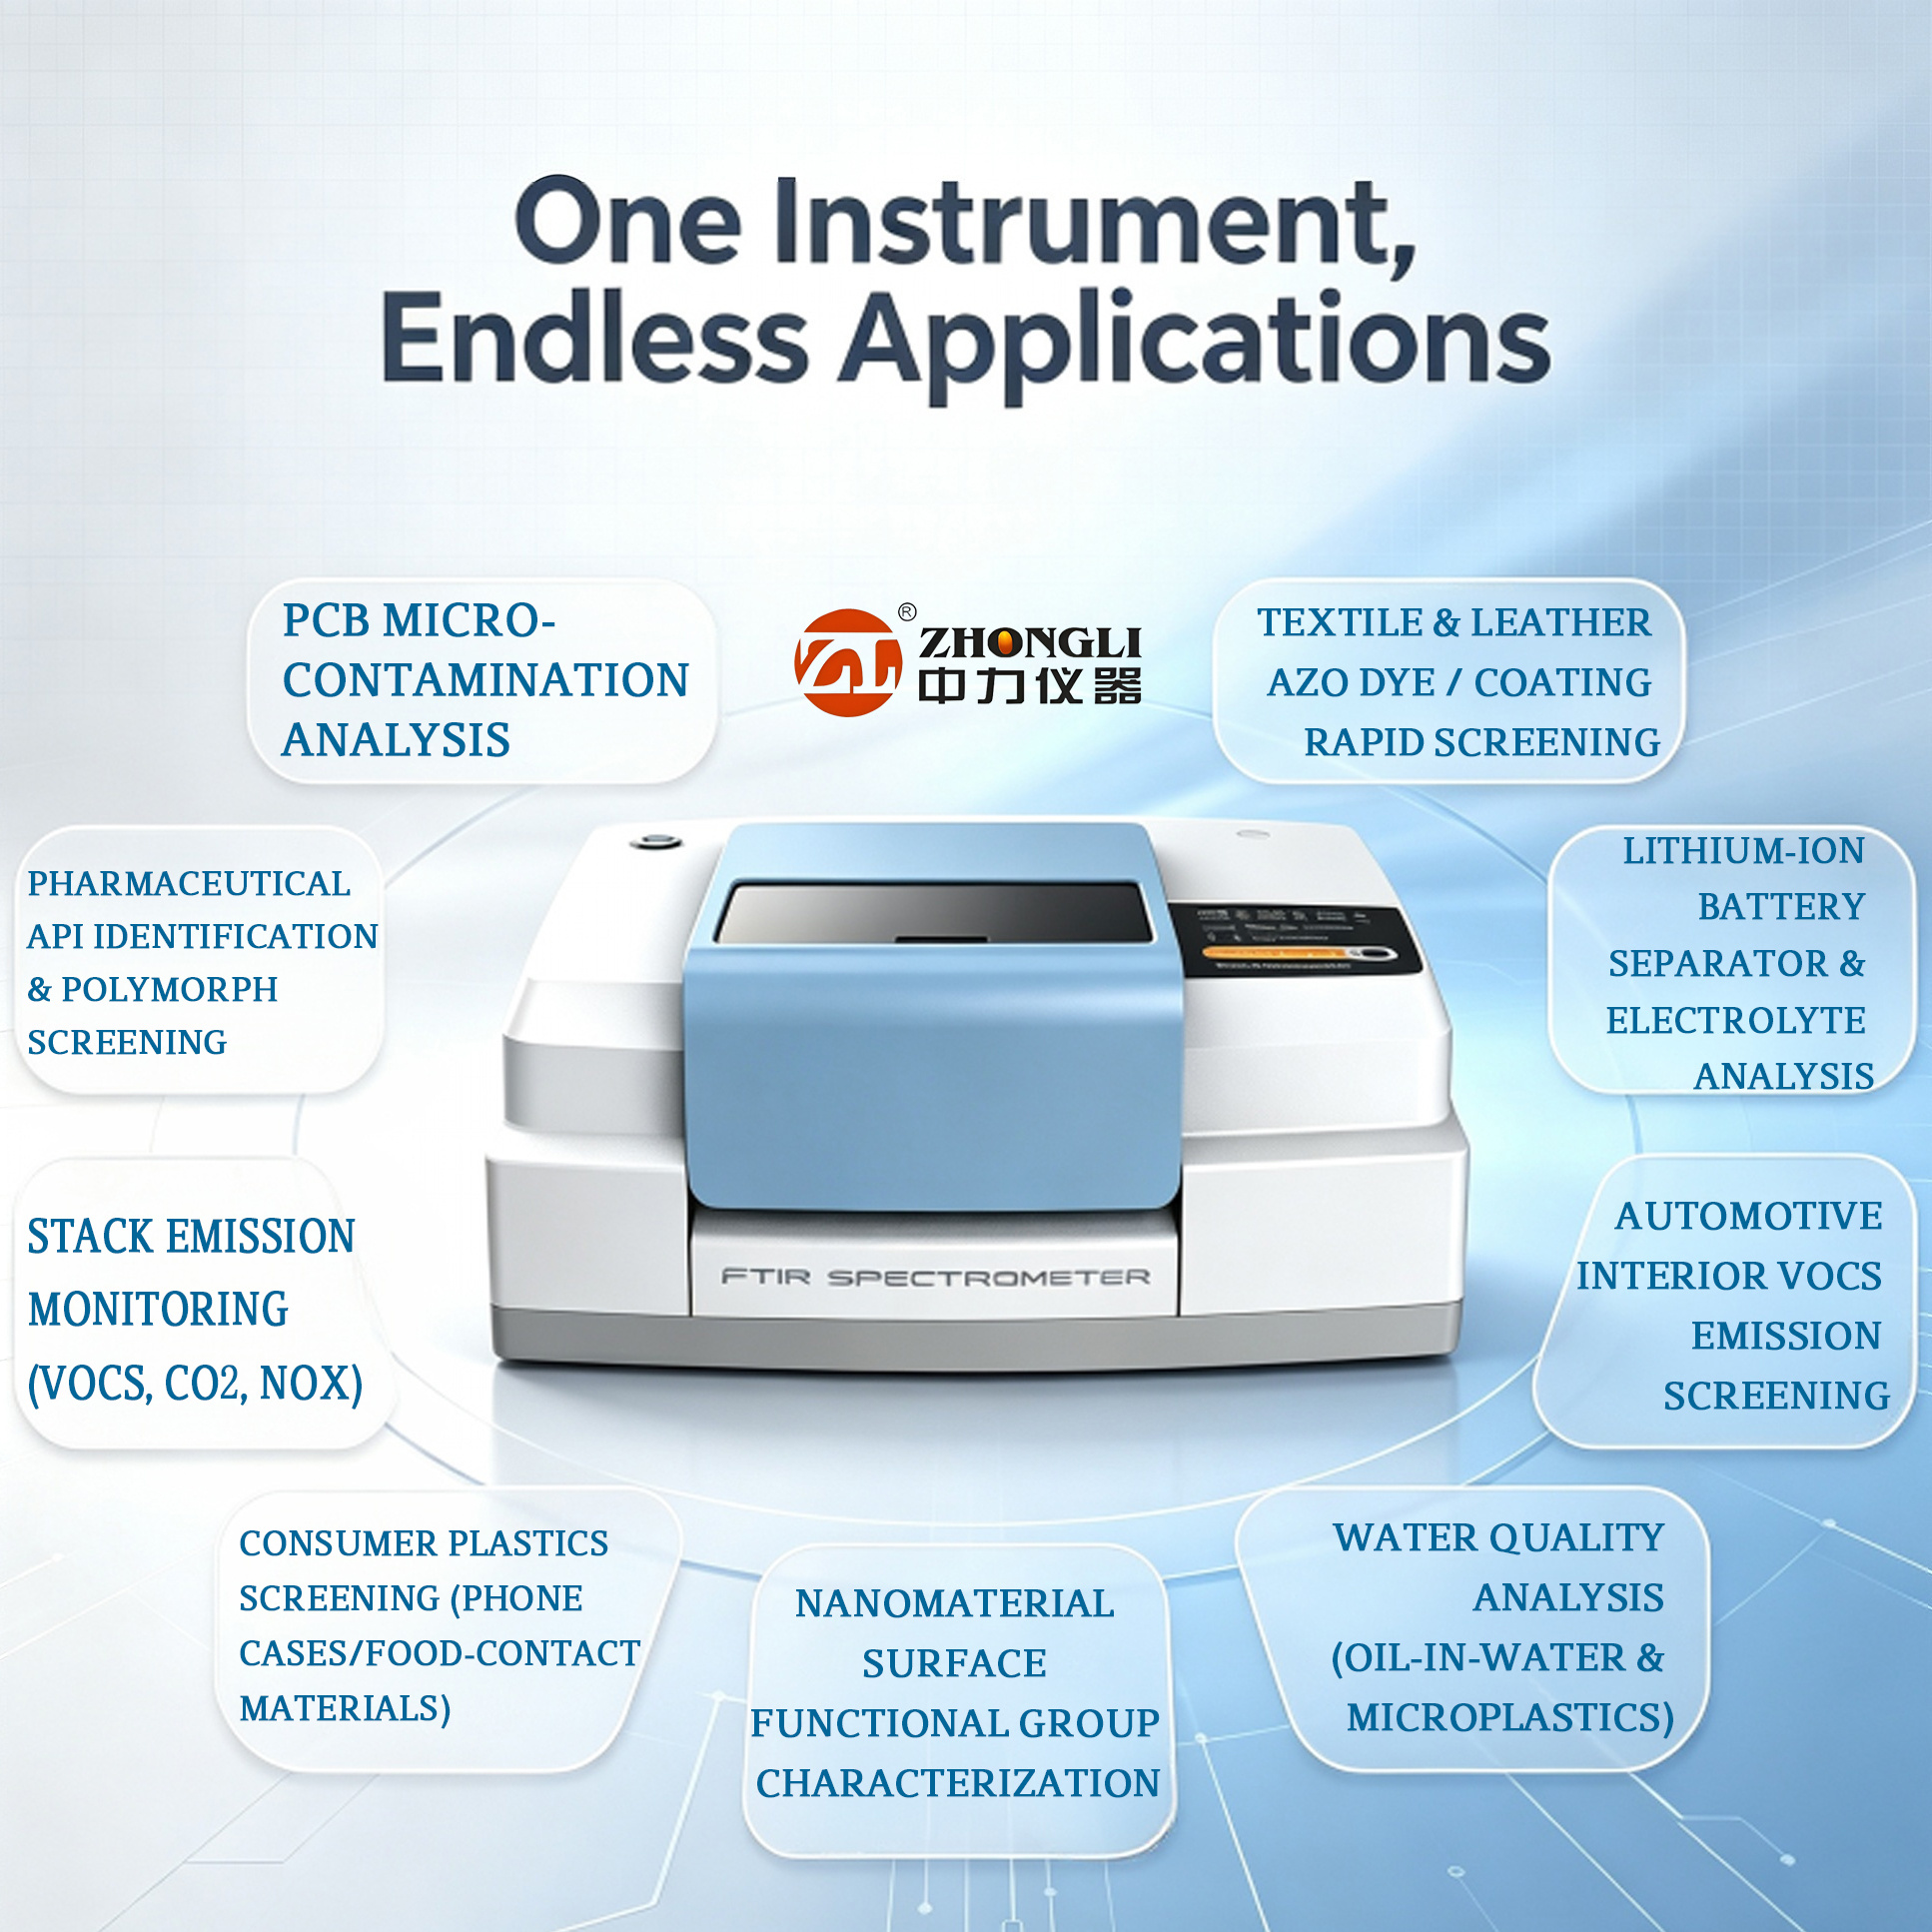
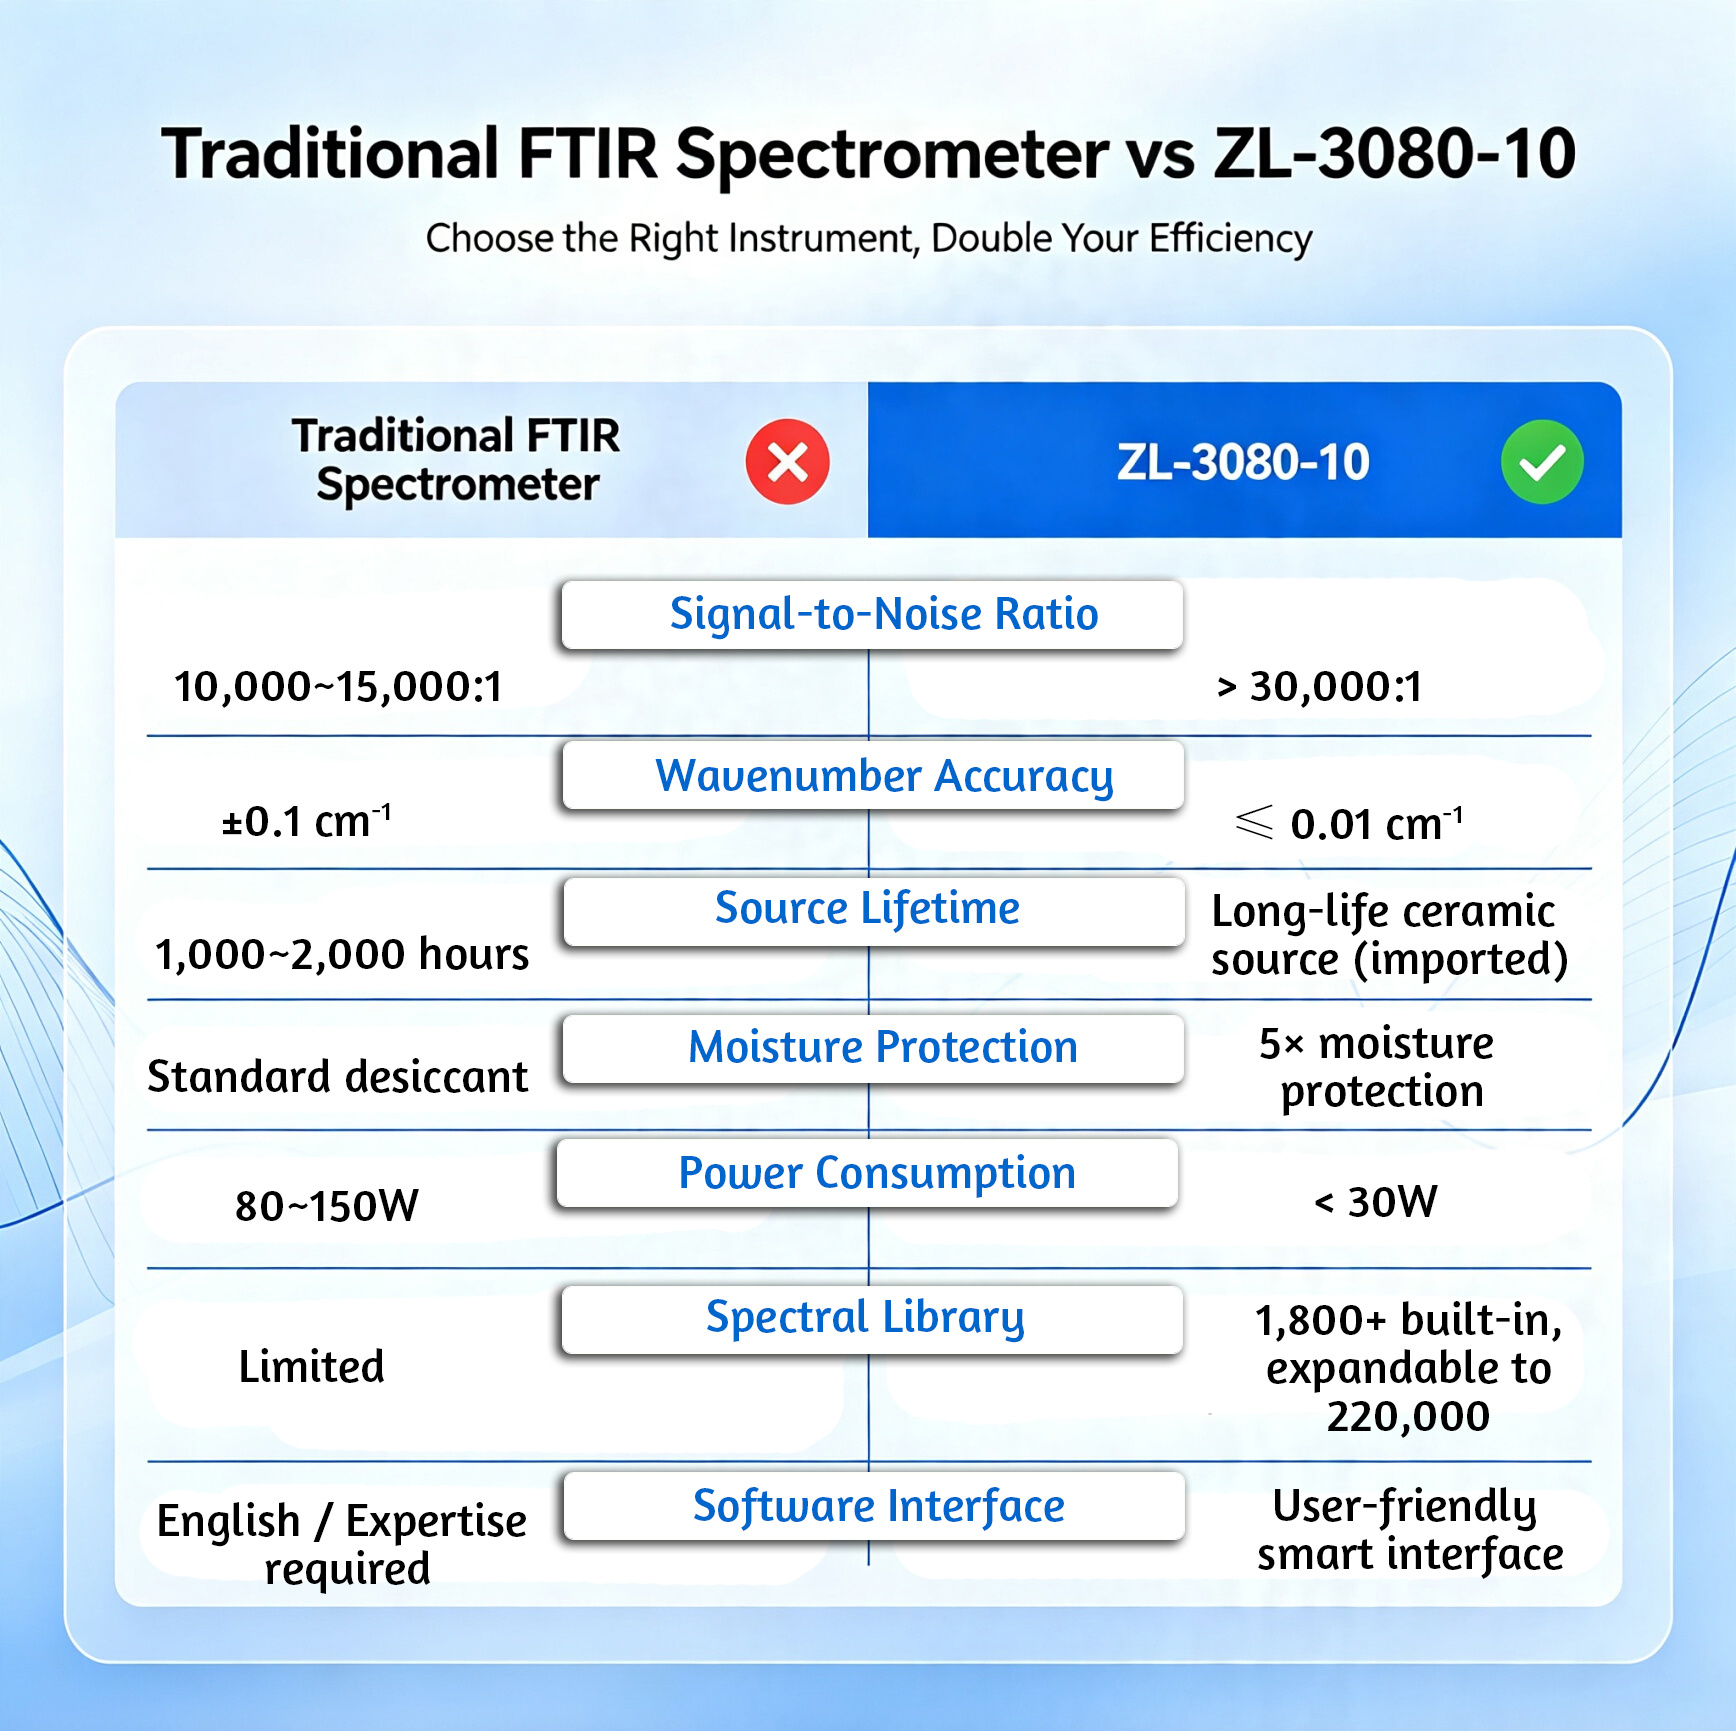
Traditional FTIR Spectrometer vs ZL-3080-10
FTIR vs Other Technologies
| Feature | FTIR | NDIR | Chromatography (GC/LC) |
| How many substances measured at once? | Dozens to hundreds | 1–3 | Multiple (but require separation) |
| Qualitative capability | Strong (fingerprint matching) | Weak | Moderate (depends on detector) |
| Quantitative capability | Strong | Moderate | Strong |
| Speed | Seconds | Seconds | Minutes to tens of minutes |
| Best suited for | Simultaneous monitoring of multiple components | Single-gas monitoring | Analysis of complex mixtures |
One-Sentence Summary: How to Choose
You want to identify dozens or hundreds of components at once (e.g., analyzing an unknown contaminant) → Choose FTIR (think: facial recognition)
You only want to track the concentration of one specific gas (e.g., monitoring CO₂ in a workshop) → Choose NDIR (cheaper, does the job) (think: measuring height)
You need part-per-million (ppm) accuracy and don’t mind waiting 20 minutes → Choose Chromatography (think: checking household registration records)
Practical Tips:
1.Background calibration is critical. FTIR relies heavily on background spectral calibration. Always measure background before sample measurement, and update it regularly (especially when temperature/humidity changes).
2.Watch out for water vapor and CO₂ interference. Both have strong IR absorptions that can interfere with sample analysis. Many FTIR instruments use nitrogen purge or sealed drying to reduce interference.
3.Sample preparation matters. ATR requires good contact between sample and crystal; transmission mode requires proper sample thickness (too thick = full absorption, too thin = weak signal).
Conclusion:
ZL-3080 FTIR is a “standard piece of equipment” in materials science, pharmaceuticals, environmental monitoring, electronics manufacturing, and more. Think of it as the “universal microscope” in the lab — it’s not the cheapest instrument, but the speed, information richness, and reliability it provides make it a worthwhile investment. If you often need to answer questions like “What is this stuff?”, “What’s mixed in it?”, or “Which step in the production line went wrong?” , then FTIR is the most worthwhile “Swiss Army knife” you can have in your toolbox.